‹ Satellite › · AgroMonitor
Detect what the eye cannot see in your plots
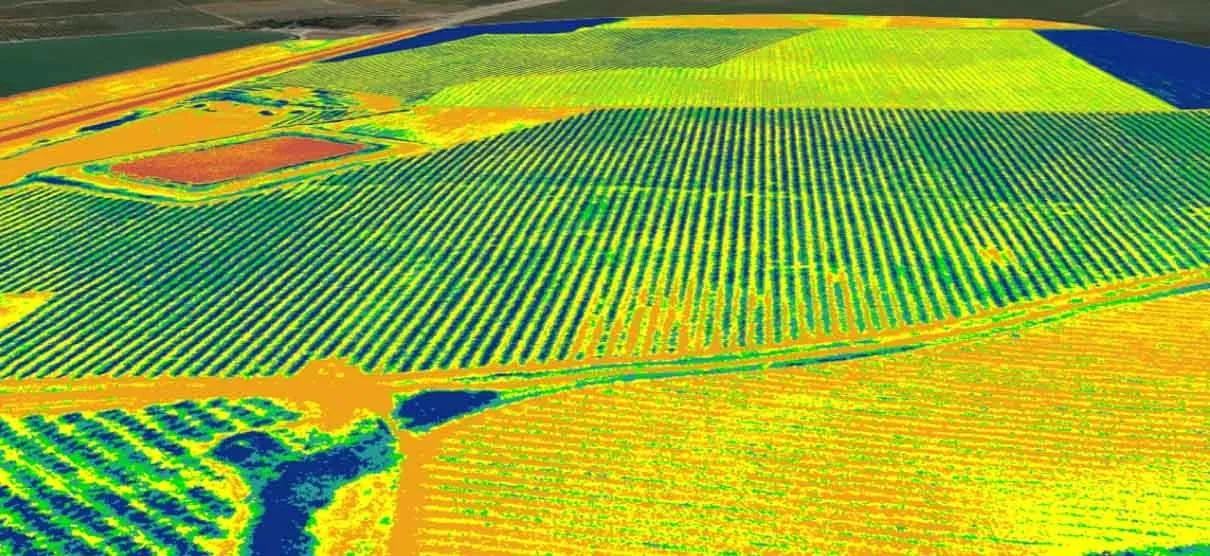
Satellite reveals stress and vigour differences invisible to the naked eye. Act before the problem blows up. Nothing to install.
Start with satellite only, scale when you want
- It shows which zones need attention first.
- It lets you compare weeks and seasons to see if things are improving.
- It uses weather and sensors to make each change easier to understand.
‹ How it works ›
See what you can't see from the ground
Not everything inside a plot behaves the same. Maps show the strong and weak zones before you notice them on foot.
Already have sensors? AgroMonitor adds their data for an even clearer picture.
‹ What it offers ›
What it offers
Features designed for real operations: see, prioritize, act, and record.
Vigor maps
They show how each area of the plot is doing and how it changes over time.
Zones that behave differently
They help you split the plot into areas so you do not manage everything the same way.
Stress detection
Early signals to intervene sooner: fewer losses and fewer late treatments.
Season-to-season comparison
Learn from history: what worked, where, and under what conditions.
Integrated context
Bring maps, weather and sensors together so the decision becomes clearer.
Reports and traceability
Exportable evidence and records for audits, requirements, and client communication.
‹ Use cases ›
Use cases
Especially useful when you manage many hectares or need zone-based decisions.
Prioritize field visits
Go first where changes appear: save time and focus effort where it matters.
Zone-based irrigation/fertilization
Avoid applying the same in different zones: adjust rates and strategy.
Detect issues
Identify irrigation, drainage, or uniformity problems before they escalate.
Validate practices
Check whether an intervention improves vigor and how it evolves with the weather.
‹ How we activate it ›
How we activate it
Fast and frictionless: from the first map to repeatable decisions.
- 01
Fields and goals
We define crops, plots, and which decisions you want to optimize.
- 02
Layer setup
We enable maps, frequency, and relevant indicators.
- 03
Zones and criteria
We create within-field zones and action criteria.
- 04
Traceability
We generate periodic reports to compare seasons and prove impact.
‹ Free demo ›
Let's talk about your farm,
no strings attached
Tell us hectares, crop and whether you already have sensors. Reply in under 24 hours with the path that fits you best.